
NFL Handicapping – Inside the Numbers Week 11
Handicapping and Analyzing Stats – NFL Inside the Numbers Week 11
Throughout the NFL season, I go inside the numbers and review weekly box scores, stats, game recaps and more after watching many of the NFL games. For over a decade, I have kept a proprietary database of statistical information and utilized relevant rushing numbers, statistical guidelines and situations to better assist me in sports investing and providing point spread winners.
You can read my weekly Fairway’s Football Forecast NFL article on this site, which went 2-1 ATS last week with two more outright underdog winners on Dallas and ugly ‘Dog Oakland, and now 8-3 ATS the last three weeks with eight outright winners and 22-15 ATS (59.4%) for the season with 19 outright underdog winners posting on the weekly underdog picks pages. I provide the weekly Inside the Numbers to better assist us in evaluating teams, stats and performances, and how to use certain stats and parameters to guide you towards more winners.
 My NFL history as a point spread prognosticator has been a winning one with recent seasons results and from 2003 through 2010 when I went 371-277 ATS (57.3%) and won 8 consecutive regular seasons as a public handicapper with all plays documented at the Sports Monitor. Some top of the leaderboard finishes included in 2010 (44-22 ATS) and 2003 (52-28). I’ve participated in the Las Vegas SuperContest, and posted back-to-back 60% ATS seasons. My start in 2015 included 16-3-1 ATS after four weeks and 29-10-1 after 8 weeks on our way to another top-6% finish out of more than 1,700 entries.
So each week I provide various insights into NFL handicapping, and the weekly Inside the Numbers article will analyze stats and ways to utilize them and how rushing guidelines and handicapping point-of-attack play can put the percentages in your favor when wagering.
Here are some Week 11 stats of note.
 Week 11 NFL favorites went just 9-4 SU and 3-7-3 ATS rating the Seahawks, Giants and Rams all as 3-point favorites and a push ATS in their 3-point wins. The Rams and Chiefs Monday night game had a record over/under 64 points posted at the sportsbooks, and the two teams put on a offensive show in the Rams 54-51 win to finish as the 3rd highest scoring game in NFL history. The sportsbooks got crushed by the bettors in that game, as most played over the total and Chiefs bettors took +3.5 before the game moved to Rams -3 on game day.
The biggest moves on the Week 11 look ahead lines from the Westgate Superbook and FanDuel were on the Panthers, Texans and Cardinals, who all failed to cover as favorites with only Houston winning straight up. We had the contrary call on the Raiders (+5.5) and Cowboys (+3.5) in our Week 11 Fairway’s Football Forecast of underdog winners, and also discussed our rushing guidelines and expected advantage with Dallas in the running game, which played out perfectly in Dallas’ 22-19 win with the Cowboys out-rushing the Falcons 132-80 and running the ball 29 times to just 18 for Atlanta.
Beating the NFL over the long-term involves an understanding of the match-ups, situations and stats, and how to apply them for success. Good fortune in the turnover column helps too. After all, teams that are plus (+3) or more in the turnover column in a game are a long-term 93% winning ATS situation. Teams with a plus-3 or greater turnover margin in a game are now 29-3 SU and 26-4-2 ATS. in Week 11, the Eagles (3-0), Buccaneers (4-0) and Chiefs (5-2) all suffered turnover troubles in defeat, but Kansas City managed to push or even win for some bettors.
Teams that had a meaningful rushing advantage over their opponent (at least 30 yards) went 6-1 SU and 5-1-1 ATS in Week 11, making it 39-2 ATS in the last five weeks and are now 88-20 (81%) ATS this season (plus pushes), and historically a 75% ATS profile with no season below 70% since 2000.
 Ravens QB Lamar Jackson made his NFL starting debut with Joe Flacco injured, and while Jackson is learning and has a ways to go in his progression as a passer, there is no questioning his speed, running ability and agility. Jackson led the Ravens in rushing with 27 attempts for 117 yards and Baltimore rushed a NFL-high 54 times for 265 yards in their 24-21 win but non-cover against Cincinnati. Running QB’s have never been or will be the way to win a NFL championship, but teams and coordinators have to adjust and Jackson adds the difficult dimension to defend against.
Teams that rushed the ball at least 30 times (when their opponent did not) went 5-1 SU and 3-2-1 ATS in Week 11 and are now 90-15-1 SU and 81-21-4 ATS this season. Teams that run the ball less than 23 times went just 2-6 SU and 2-5-1 ATS in Week 11 and are now 8-86 SU and 16-78 ATS. Handicapping point of attack play and determining which team will have more success running the ball and controlling the ball, clock and chains will get you more point spread winners.
Week 11 rushing leaders included the Ravens (265 rush yards / 54 carries), Jaguars (179/43), Saints (173/37), Seahawks (173/35), Bears (148/39), Cowboys (132/29). Interesting that in two games both teams rushed at least 30 times for at least 130 yards – Cardinals vs Raiders and Giants vs Bucs.
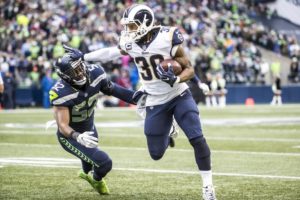 The power of running the ball can perhaps be best illustrated this way. Thus far through 11 weeks, teams that rush the ball at least 30 times in a game when their opponent does not are 90-15-1 SU and 81-21-4 ATS. So teams that run the ball at least 30 times when their opponent does not have covered the point spread > 80% of the time.
Remember that when the media members, talking heads or your fantasy football friends tell you how important passing the ball is, and remember to run your way to profits and the cashiers window. At least 30 rushes a game is pure profit, while less than 23 rushing attempts per game is a proven loser.
The quarterback play is clearly most important in the NFL, and QB ratings from starter to backup can impact a betting line at by at least 6 points (see link and chart). Lamar Jackson is now a downgrade from Joe Flacco, but his performance and continued improvement could change that. There is also another QB change going into Thanksgiving and Week 13, as Colt McCoy replaces injured Alex Smith on the Washington Redskins after Smith suffered a terrible tibia and fibula injury against the Texans.
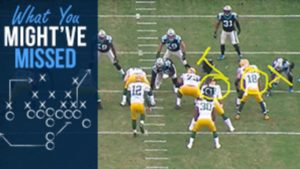 As you become better at understanding and recognizing point of attack play and which teams will have success rushing the football and/or stopping the run, you’ll become more proficient and the point spread winners will follow. Many other factors come into play in evaluating games and match-ups, including the quarterback play. But the ability to understand situations and make adjustments to changes, personnel, match-ups, injuries, weather and put all the stat profiles together will allow you to become better at handicapping and forecasting the games.
Teams that had strong offensive showings and efficient yards per play (yppl) in Week 11 victories were the Saints, who led the way for the second straight week (546 yards/7.9 yppl), Rams (455/6.1), Colts (397/6.6) and Giants (359/6.8). In defeat, the Chiefs (546/7.9), Buccaneers (510/7.5) and Chargers (479/6.7) were very efficient on offense.
Inefficient offensive teams in Week 11 included the Eagles (196/4.1), Redskins (278/3.8), Vikings (268/4.3), Titans (263/4.5), Bengals (255/4.7) and Jaguars (243/4.6).
The league average is above 5.6 yards-per-play; up from past 5.4 yards per play in recent seasons. Here is the best and worst of all teams in offensive yards per play this season. Best – Chiefs (7.0), Chargers (6.9), Rams (6.6). Worst – Bills (4.2), Cardinals (4.4), Titans (4.9) and Jets (4.9).
NFL scoring is having a record season averaging 48.1 points per game. The Saints, Chiefs, Rams, Steelers, Colts and Bears are all averaging at least 29 points per game. In the last three seasons combined, just 5 teams averaged at least 29 points per game. 2014 was the last season in which there was at least four teams that averaged 29 or more points per game.
We’ll review more NFL stats and information each week as we continue to evaluate the results, match-ups and work to become even more proficient in point spread prognosis. You can bet on it.

 Twitter
 Facebook