NFL Inside the Numbers Week 6
Handicapping and Analyzing Stats – NFL Inside the Numbers Week 6
Throughout the NFL season, I review weekly box scores, stats, game recaps and more after watching many of the NFL games. For over a decade, I have kept a proprietary database of statistical information and utilized relevant rushing numbers, statistical guidelines and situations to better assist me in sports investing and providing point spread winners.
Week 6 was a big one for the sportsbooks, as public bettors were buried by betting favorites who went 4-9-1 ATS. Totals went 9-5 over/under with 48.6 points per game average. We had our worst week of the season and while focused on totals for Members, those plays were worthless and Top Plays too. Just three side plays and with two ‘Dogs, but only the Browns came through.
Here are some Week 6 stats of note.
A few eye-opening stats in the Packers-Chargers game, as Philip Rivers passed 65 times for 503 yards and very solid 7.7 yards per pass but San Diego lost 27-20 as big ‘Dog. The Chargers had 32 first downs and 38 minutes of possession time. Plenty of road favorites went down including top teams Atlanta, Arizona and the Patriots failed to cover at Indy in victory while the Broncos escaped at Cleveland but also failed to get the money.

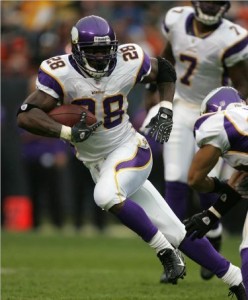
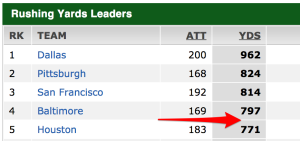
Vikings RB Adrian Peterson may move past Marshall Faulk into Top-10 all-time rushers by season’s end
Beating the NFL over the long-term involves an understanding of the match-ups, situations and stats, and how to apply them for success. Good fortune in the turnover column helps too. After all, teams that are +3 or more in the turnover column in a game are a long-term 93% winning ATS situation. Three more teams suffered turnover troubles in Week 64 as the Falcons (3-0), Jaguars (3-0) and Cardinals (3-0) all suffered negative turnover margins of 3 or more in SU/ATS losses. Teams in this negative turnover situation are now 1-16 SU/ and 0-17 ATS this season and just one team last season won the game with a negative 3-or-greater turnover differential. Dallas won the game but did not cover in week 1 this season despite a 3-0 turnover disadvantage.
Teams that had a meaningful rushing advantage over their opponent ( at least 30 yards ) went 7-2 SU and 5-3-1 ATS in week 6, and teams that rushed for at least 150 yards went 5-1 SU and 3-2-1 ATS. For the season, this rushing guideline and situation is 44-19 ATS (70%). We’ll discuss our rushing guidelines throughout the season, but if you can correctly handicap this situation and advantage in a weekly NFL match-up and it plays out accordingly, you’re well on your way to cashing more tickets and point spread winners. Clearly it’s not an easy forecast and when a team falls behind by margin they often have to abandon the running game. For over a decade, teams that out-rush their opponent by at least 30 yards in a NFL game cover the point spread approx. 75% of the time. There has not been a season since 2000 when this has been below 70% on average. Pay attention to offensive line play and key injuries along the line as those can greatly affect the teams rushing attack and game plan.
 Clients have paid me for over a decade for my expertise and ability to proficiently project point spread winners because I not only understand point of attack play and rushing guidelines used for success, but because it’s also important to understand situations and make adjustments to changes, personnel, match-ups, injuries, weather and more.
Week 6 big ground gainers in rushing included the NY Jets (221 rush yards/41 attempts), Dolphins (180/32), Eagles (155/37), Lions (155/32), Steelers (141/32), and the Broncos (152/32) and Falcons (150/21) in defeat. Follow rushing attempts stats and look for teams and match-ups where you anticipate them running the ball at least 30 times in a game, as that is another key indicator to point spread and winning success.
The Redskins (34/17), Cardinals (55/20), Chiefs (57/18), Chargers (60/20), Texans (63/18) and Ravens (77/22) all struggled to get their running game going in defeat.
But the point of all this is that rushing stats and point of attack play often trumps passing prowess a majority of the time. In week 6 look no further than the pretty passing numbers of the Cardinals (414) and Chargers (503), who have top-tier QB’s but couldn’t overcome ground game issues and negative turnover differentials. When you have a few top-tier quarterbacks that can overcome a poor ground game or use it as a short passing attack (Manning), sometimes a lack of a running game can work out. A dominant defense helps. But regardless of all the talking heads telling you that teams must have a passing game to succeed in the NFL, I’ll point you to my weekly articles and stats that suggest otherwise and that perception is not reality in the pass/run success argument of the NFL. We have the adjust to the rules and changes in the game allowing for more passing game success and now more scoring in recent seasons, but the game is still about blocking, tackling, running and catching and the team that controls the line of scrimmage, establishes a running game (or more attempts) and minimizes turnovers is often the team that comes out on top.
Teams that had strong offensive showings and efficient yards per play (yppl) in week 6 victories were the Lions (546 yards/7.2 yards per play in OT), NY Jets (474/7.1), Patriots (417/6.5), Eagles (425/5.6), Broncos (442/5.5), and Dolphins (434/6.9), 49ers (391/7.1) and Packers (370/7.6). Inefficient offensive teams included the Redskins (225/3.6), Giants (247/3.9), Browns (298/3.9, Titans (299/4.6) and Vikings (321/4.7). The league average is approximately 5.4 yards-per-play.
Week 7 early projections suggest the following teams will have an advantage at the point of attack and out-rush their opponents by a potential margin: NY Jets, Rams, Vikings, Falcons and perhaps the Raiders.
We’ll review more NFL stats and information each week as we continue to evaluate the results, match-ups and work to become even more proficient in point spread prognosis.

 Twitter
 Facebook