College Football Handicapping – Defensive Dominators
Evaluating The Stats And College Football Defensive Dominators
In seasons past I’ve written many articles on college football using statistical indicators and profiles to assist you in college football handicapping. That includes my recent article on this year’s most powerful and balanced elite offenses. Public bettors love to bet on high-octane offensive teams, but the sports books know that and also adjust to those tendencies and public perception. That includes when posting totals, as more bettors play overs than unders.
Now we turn to the defensive side of the ball and isolate defensive dominators. By using these stats and updating them weekly, you can be better prepared and isolate more match-ups of interest and point spread winners. As teams push towards the finish of the college football season, use these stats and watch the weather as the defensive dominators are teams you can count on in tougher match-ups.

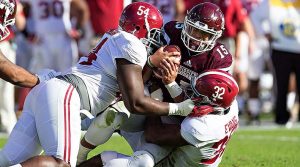
Alabama’s Defense is dominating again in 2016
With a number of conference games played, we can more realistically analyze the proven teams and performers as the statistics become more clear. But note the match-ups each week as teams face more opponents operating out of spread formations and utilizing more up-tempo or no-huddle attacks. Note team’s strength of schedule and hidden or meaningful match-up stats in box scores.
We’ve seen a shift and increase in scoring and yards. The national scoring average increased to a record 29.65 points per team in 2015, according to official numbers compiled by the NCAA. That was the fourth straight season that teams averaged over 29 points per game. In 2006, teams averaged 24.6 points per game before jumping to a then national record 28.4 points per game in 2007.
So defense is even more important for teams to slow the increased scoring of additional teams as games average nearly 60 points per game again this season.
Each season we adjust our numbers and profiles based on specific parameters with scoring and yardage increases, and we sort through the more meaningful stats and understand the strengths and weaknesses of teams and opponents.
Here is this year’s list of defensive dominators through October 31, 2016 who must meet the following criteria:
Allow 360 or less yards per game ( YPG )
Allow 150 or less rushing YPG
Allow 24 or less points per game ( PPG )
Allow 5.2 or less yards per play ( YPPL )
PPG – Points-Per-Game YPG – Yards-Per-Game
YPPL – Yards-Per-Play – YPR – Yards-Per-Rush
| Team | PPG | YPG | YPPL | Rush YPG/YPR |
| Michigan | 11.6 | 231 | 3.8 | 111 – 3.3 |
| Florida | 11.7 | 240 | 3.8 | 105 – 3.0 |
| Wisconsin | 14.6 | 301 | 4.6 | 109 – 3.3 |
| Alabama | 14.9 | 275 | 3.9 | 71 – 2.2 |
| Ohio State | 15.1 | 301 | 4.4 | 130 – 3.6 |
| LSU | 15.3 | 305 | 4.2 | 101 – 2.8 |
| Auburn | 16.1 | 358 | 4.9 | 126 – 3.7 |
| Appalachian St | 17.8 | 336 | 4.9 | 117 – 3.8 |
| Army | 17.9 | 275 | 4.7 | 119 – 4.0 |
| Nebraska | 18.4 | 342 | 5.2 | 137 – 4.4 |
| Western Michigan | 19.1 | 358 | 5.2 | 135 – 4.0 |
| Stanford | 19.1 | 356 | 5.1 | 143 – 4.0 |
| San Diego State | 19.4 | 301 | 4.5 | 94 – 3.0 |
| Colorado | 19.7 | 338 | 4.7 | 142 – 3.8 |
| Clemson | 20.1 | 348 | 4.6 | 148 – 3.8 |
| Virginia Tech | 21.1 | 345 | 4.9 | 116 – 3.3 |
| Minnesota | 21.3 | 341 | 4.5 | 133-3.6 |
| Louisville | 22.9 | 304 | 4.4 | 112 – 3.2 |
| Houston | 23.9 | 327 | 4.7 | 101 – 3.0 |
With 128 FBS teams on the college football betting board, there are currently 7 teams allowing 17 points or less per game in scoring defense, which has dropped from the start of October as teams play more conference games. Note I’ve identified some teams below to watch as they are near defensive dominator status but fall just short in a category or two. I’ve strengthened our stat profiles by including games and stats from FBS opponents, so none of the stats above include games against FCS opponents. Update your stats and info weekly and adjust for strength of schedule along with other statistical, situational and motivational parameters as you shoot for more point spread winners.
Teams to watch – Air Force, Baylor, Boise State, Boston College, Iowa, Miami (FL), Ohio, Troy, Wake Forest, Washington, West Virginia

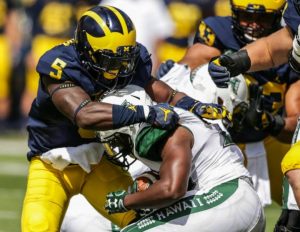
Jabrill Peppers leads Michigan’s dominant No. 1 scoring defense
You can strengthen the profiles by evaluating a team’s net yards-per-play differential, between offensive yards-gained and defensive yards allowed, which is often a key statistical indicator for winning and ATS success.
The purpose of this article is to identify some of the stronger defensive teams, and also encourage you to dig a little deeper in your own evaluation of teams, schedules and stats. Some of these teams will fall off this list in the weeks ahead, while others I’ve noted that are close may move into dominator status soon. Know too that as teams push for conference titles, bowl bids and play their biggest rivalry games in November, the intensity will rise and many times the defensive play will follow. Even players on losing teams with defensive deficiencies know they must play hard down the stretch to earn their starting spots for next season.
Supporting strong defensive teams is usually a good starting point in your analysis of a contest and match-up, but note injuries, turnovers, motivation and other negative yardage or factors as you analyze the opponent and schedules. Defensive profiles can also assist you in totals betting, which can be even more effective with scoring increases, rising posted totals and more inclement weather ahead.
I hope this information is useful to you. If you don’t have the time, energy or ability to research this or other statistical parameters and profiles to select more point spread winners, then join me and other winning members and Fairway followers and we’ll win together.

 Twitter
 Facebook