
NFL Inside the Numbers – Week 4
Handicapping and Analyzing Stats – NFL Inside the Numbers
by @FairwayJay
Throughout the NFL season, I review weekly box scores, stats, game recaps and more after watching many of the NFL games in my weekly NFL Inside the Numbers article. For over a decade, I have kept a proprietary database of statistical information and utilized relevant rushing numbers, statistical guidelines and situations to better assist me in sports investing and providing point spread winners. Every week during the NFL season I provide my thoughts and insight on my NFL Inside the Numbers column to assist you in your pursuit of profit. Also, listen to my NFL Podcast each week where I provide insight and analysis into the upcoming Sunday games.
NFL Inside the Numbers Week 4 Stats of Note.
Week 4 NFL Favorites went 9-6 straight-up (SU) and 9-6 ATS against the spread (ATS), and are now 44-19 SU and 33-28-2 ATS year to date. Over/under totals were 8-6 and now 31-31 YTD.
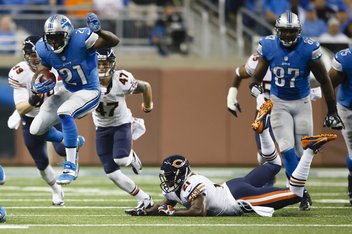
Reggie Bush and the Detroit Lions defeat the Bears.
Our Big Bertha top-total play of the week cashed easily as the Lions beat the Bears 40-32. Some very unfortunate losers on our 5-2 early games card were the Texans +2.5 and Seahawks/Texans under 42 – a 23-20 Seahawks win in overtime after Houston dominated and led 20-6 into the fourth quarter before a late Pic-6 sent the game to OT – ugh. Houston rushed for 151 yards, had a 476-270 yard advantage and 5.4 yards per play (yppl) to 4.7 yppl edge, but lost at home. Outright underdog winners included the Browns and Bills along with another top-play Big Drive winner on the Browns/Bengals ‘under’ the total; 17-6 Browns win.
Betting and beating the NFL over the long-term involves an understanding of the match-ups, situations and stats, and how to apply them for success. Turnovers will always have an impact on NFL games and especially against the spread (ATS), as I’ve tracked the impact of 3 or more turnovers for over a decade along with a 2-turnover differential advantage or disadvantage. After all, teams that are +3 or more in the turnover column in a game are a long-term 93% winning ATS situation. The Jets (4-0) and Dolphins (4-1) were this week’s big turnover differential losers. Yet four other teams that had a +2 TO differential went 4-0 SU/ATS as the Vikings, Bills, Browns and Colts all won the turnover battle and SU/ATS wins. Teams that are +3 or more in the turnover column are now 8-0 SU and 7-1 ATS.
Teams that had a meaningful rushing advantage over their opponent went 5-2 ATS in week 4. We’ll discuss our rushing guidelines throughout the season, but if you can correctly handicap this situation and advantage in a weekly NFL match-up and it plays out accordingly, you’re well on your way to cashing more tickets and point spread winners. For over a decade, teams that outrush their opponent by at least 30 yards in a NFL game cover the point spread approx. 75% of the time. There has not been a season since 2000 when this has been below 70% on average.
Clients have paid me for over a decade for my expertise and ability to proficiently project point spread winners because I not only understand point-of-attack play and rushing guidelines used for success, but because it’s also important to understand situations and make adjustments to changes, personnel, match-ups, injuries, weather and more.
Week 4 big ground gainers in rushing included the 49ers (219 rush yds/40 attempts), Bills (203/55 rushes!), Lions (159/30) and Colts (154/29). These teams went 4-0 SU and ATS.

The Rams (18 rush yds/19 attempts), Ravens (24/9 rush attempts!), Jaguars (40/18), Cardinals (56/20), Falcons (58/15), and Bengals (63/20) all struggled to get their running game going. These teams went 1-5 SU and ATS. While the game flow, situations and score can impact a team’s game plan and use of the running game, it’s proven over and over, season after season that teams who fail to commit to the running game or lack consistency in the ability to run the ball and control the ball, clock and chains are more often on the losing side of the ledger, both SU and ATS.
Teams that had strong offensive showings in total net yards and efficient yards per play (yppl) in victory were the Chargers (506/7.2), Broncos (472/6.6), Saints (465/7.2), Patriots (448/7.2), Colts (437/6.2) and Vikings (393/7.7). The NFL team average yards per play is approx. 5.4. Inefficient offensive teams in defeat included the Rams (188/2.9), Jaguars (205/3.8), Bucs (253/3.3) and Bengals (266/4.2).
We’ll review more NFL Inside the Numbers stats and information each week as we continue to evaluate the results, match-ups and work to become even more proficient in point spread prognosis. Listen to my NFL Podcast posted early each week on Tuesday’s for more insight, analysis and sports betting information.
Stay on Course…
@FairwayJay
Questions, comments? Submit a comment below and I will personally answer it.
 Twitter
 Facebook