College Football Handicapping – Powerful And Balanced Offenses
Isolating Powerful And Balanced Offenses – Teams That Run and Pass For At Least 200 yards
As we make the turn at the halfway point of the college football regular season, we can now utilize some stronger statistical numbers in evaluating teams and match-ups. All BCS conference teams have now played at least two conferences games to give us realistic projections on their performance vs. similar opponents. No more “false favorites” who padded their numbers vs. a soft non-conference schedule.
I annually research and document offensive and statistical profiles of teams, and usually start posting updates near mid-October. One of the indicators I use for offensive strength is not just yards gained or yards per play, but how the teams accumulate those yards. Addressing opponents and strength of schedule is another factor you must evaluate once you review the numbers and statistical profiles.
This week we look at the offensive side of the ball. One specific area of strength I pay attention to at this time of year are teams which have strong, balanced offenses. As a guideline, I look for teams who both run and pass the ball for over 200 yards-per-game on average. As of October 16, 2014 there are 20 teams that both run and pass for at least 200 yards per game against all opponents ( including FCS ). There were 24 such teams at this time last season. Note that there are 36 teams that rush for at least 200 ypg ( 28% of the 129 FBS teams ) and 55 teams that pass for at least 250 ypg, as teams that run for 200+ and pass for 250+ are your most powerful and balanced offensive teams – there are currently 8 such teams ( 12 at this time last season ).
However, in my stats and chart below, I have identified team’s stats excluding games against non-FBS opponents ( FCS ). Teams listed must also score at least 30 points-per-game ( PPG ). So this too should provide more realistic statistical indicators against FBS competition and not using stats against lesser FCS opponents. For example, we don’t include Baylor’s stats or scoring from their 70-6 thrashing of Northwestern State in which they piled up 706 yards offense
The ability to run the football effectively also helps on the defensive side of the ball by keeping a defense fresh. In past seasons I used 200 yards as the “balanced, power” guideline for both running and passing. However, you may recall in 2006 that offensive production was reduced by nearly 10% with the clock rule changes that season. That didn’t last long, and we’re back to more teams running for near 200 ypg while we have more teams actually passing for at least 250 ypg.
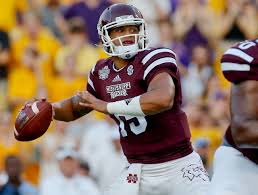
Currently, there are 62 teams ( 49% ) that average at least 420 total yards-per-game on offense. As such, I suggest you take a closer look at teams that run for at least 200 YPG and pass for at least 225 YPG in identifying the strongest balanced offenses. Of course, you need to evaluate previous opponents and adjust accordingly based on opponent strength of schedule and the upcoming schedule and opponents defensive strengths to feel more confident in your team’s ability to sustain their offensive production and balance. The power teams can be attractive teams to bet on, especially as an underdog. Such is the case with Mississippi State, who has been on our Members card in all three SEC games and the Bulldogs have rolled to three impressive wins with two as underdog. If our power team has a strong defense to support this high-powered balanced offense then they often become an even stronger play in an underdog role; a situation I’ve used many times in the past and again this season noting Mississippi State as exhibit A. The Bulldogs were un-ranked prior to their September 20th game at LSU, and now they are the #1 ranked team in the land!
Good defensive coordinators can take an average defense and slow down another team’s offense if they lack balance. Thus, high-powered passing teams that lack a solid running game are susceptible to an inconsistent performance, especially if their own defense is not up to ‘par’ to hold down an opponent ( see California last week vs. Washington ).
Update your numbers weekly and pay attention to on-field performance, especially vs. quality opponents. You’ll be laying a pretty big price with some of these power teams in the weeks ahead, so continue to evaluate on-field performance and dig deep into the injury reports as well. Pay attention to key losses and how a team performs so you can project letdown situations and recognize when a team has a match-up edge. As you become more proficient in evaluating team’s strengths and weaknesses, you’ll find yourself with more tap-in birdies, and build your bankroll by getting the green.
I’ve included some additional solid, balanced offensive teams not listed in the table below. Follow all these teams’ progress in the weeks ahead. Duke ( 219/188 ), East Carolina ( 191/371 run/pass), LSU ( 190/198 ), Louisiana – ULL ( 195/218), Memphis ( 195/233 ), Northern Illinois ( 193/215 ) Oklahoma ( 191/255 ), UCLA ( 194/285 ), Utah ( 193/185 ).
Teams with qualifying stats but less than 30 PPG scoring include Arkansas State ( 206/227) & Texas State ( 203/209 ).
Strong, balanced and high-scoring offenses that score at least 30 points per game, run for 200+ YPG and pass for 200+ YPG vs. FBS opponents are listed in the chart below. Note that these are NCAA statistics and rushing yardage and yards-per-rush includes quarterback sack yardage.
Rushing yards, yards per rush ( YPR ), passing yards, yards per pass play/attempt ( YPPL ), points per game ( PPG )
College Football Powerful And Balanced Offenses – Stats vs. FBS Opponents Only Through Oct. 16
| Team | Rushing | YPR | Passing | YP Pass | PPG | |
| Alabama | 211 | 4.8 | 209 | 9.5 | 33 | |
| Arizona State | 204 | 5.8 | 350 | 8.7 | 40 | |
| Auburn | 262 | 5.6 | 226 | 8.6 | 39 | |
| Baylor | 249 | 4.9 | 354 | 8.4 | 49 | |
| BYU | 211 | 4.6 | 216 | 6.6 | 32 | |
| Marshall | 264 | 5.9 | 305 | 9.4 | 48 | |
| Michigan State | 256 | 5.4 | 234 | 7.7 | 45 | |
| Middle Tennessee St | 215 | 4.8 | 252 | 7.8 | 42 | |
| Mississippi State | 264 | 5.5 | 265 | 9.1 | 42 | |
| Nebraska | 325 | 6.3 | 226 | 8.2 | 44 | |
| Ohio State | 247 | 4.9 | 276 | 10.0 | 44 | |
| Oregon | 202 | 5.0 | 290 | 10.1 | 40 | |
| Rice | 201 | 4.3 | 224 | 8.3 | 30 | |
| Toledo | 231 | 6.0 | 245 | 7.1 | 31 | |
| UAB | 211 | 4.1 | 280 | 10.3 | 40 |


 Twitter
 Facebook