
Analyzing College Basketball’s Defensive Dominators
Identifying Defensive Dominators with Stat Profiles and Proven Performance
The push for regular season titles, conference championships, playoff positioning and NCAA tournament bids continues into February as the battles on the college basketball hardwood really heat up. Two weeks ago I outlined some betting results and statistics, and provided some handicapping lessons and insight. Second meet situations provide a different dynamic in conference rematches, and we saw one of those
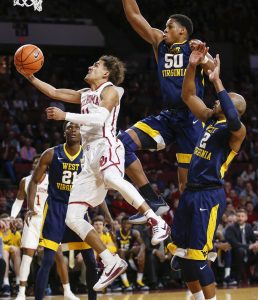
Oklahoma’s Trae Young (11) takes the ball to the basket vs West Virginia
Monday night when West Virginia won on the road at Oklahoma 75-73 for a season sweep of the Sooners. That key contest is one of many down the closing stretch of the regular season, and we note that Oklahoma was leading the nation in scoring at 90 points per game prior to being held to 73 by West Virginia. The Mountaineers, under savvy and super coach Bob Huggins, are not quite defensive dominator status this season, but West Virginia (7-4) is still in the race for the Big 12 regular season title trailing league-leaders Kansas (7-3) and newcomer Texas Tech (7-3), who is a strong entrant on our defensive dominator list below and our pick with 8 games remaining to win the Big 12 and end Kansas’ remarkable 13-year win streak as regular season conference champs.
Handicappers, bettors and sports books adjust to the momentum swings, betting lines and the change in scoring and pace of play with the shot clock reduction. This season, there are 26 college basketball team’s averaging 83 points per game. Last year there were 14 teams that scored 83 PPG in games involving two NCAA division 1 teams. There is also 27 teams making at least 10 three-pointers per game, while last season there were eight, showing the influence of the 3-point shot in today’s game.
But as scoring, possessions and three-point shooting increases, and we make adjustments in our handicapping and evaluation of teams, it’s still important to follow the basic principles and fundamental focus when you evaluate stats and how teams play. On offense the team must value the basketball with a positive assist to turnover ratio. Good shot selection remains an absolute must if a team wants to experience success. Thus coaching philosophies of good shot selection and the concepts of boxing out and rebounding are key to increasing the number of possessions, as is the percentage of loose balls and steals a team can create. Converting a high percentage of foul shots is important, especially late in games.
 Utilizing a site like KenPom.com can provide you key stats, adjusted numbers, efficiency and tempo ratings and match-up analysis. However, I also go to conference web pages and review stats and specifically at this time of year conference only statistics for teams and players. With so many stats and situations to evaluate, a good indicator of a team’s success and ability to compete consistently can be gauged in opponent’s field goal percentage. Field goal percentage defense is more important than points allowed, because an opponent’s points can be determined to a degree by the number of possessions they have which in turn can be influenced by an offensive pace that creates lower overall possessions in a game. That’s why you see a team like Virginia, currently ranked No. 2 in the country and perennially a top defensive team, slow down teams every year. Influenced and led by one of the nation’s premier coaches in Tony Bennett, the Cavaliers defend relentlessly and force long possessions, and this season held North Carolina to 49 points and Duke to 63 points, each more than 25 points below their season scoring average.
Isolating a team’s overall defensive field goal percentage and 3-point field goal percentage defense remain key indicators when judging a team’s defensive ability. These must work in tandem to be efficient since a team can pack the paint defensively to minimize higher percentage two-point shots while sacrificing defense outside the arc. Conversely, too much attention to perimeter defense can sacrifice a team’s ability to defend the paint. When a team combines solid defensive play with rebounding strength and the ability to block or alter shots, you have a team that is capable of competing most any night against any team.
Yet, while strong defensive play is often key to winning more basketball games, successful teams also take care of the basketball, minimize turnovers and have a solid assist/turnover ratio, create steals and take good shots and control the boards. Thus, look at rebounding rate as another key indicator when evaluating match-ups and working in tandem with defensive shooting percentage and efficiency.
![]() With these concepts in mind it’s up to the handicapper and sports bettor to determine a team’s motivation level, how they match-up with each opponent and how these statistics can be used and adjusted throughout the season based on quality of opponent faced. Some teams play softer schedules and opponents in the early part of the season while also adjusting to new players, coaches and systems. I like to focus on “conference only” statistics as a more accurate barometer of a team’s overall strength. As teams push towards the finish of the conference season and into postseason play, we have a more accurate barometer with a number of games and meaningful conference stats to review. You can use some of the stats below for the rest of the regular season and into post season play as you do your match-up analysis. The defensive dominator chart is also a good guide to reference for the start of next season when factoring in returning starters, coaching philosophy and a team’s defensive strength in a system.
With these concepts in mind it’s up to the handicapper and sports bettor to determine a team’s motivation level, how they match-up with each opponent and how these statistics can be used and adjusted throughout the season based on quality of opponent faced. Some teams play softer schedules and opponents in the early part of the season while also adjusting to new players, coaches and systems. I like to focus on “conference only” statistics as a more accurate barometer of a team’s overall strength. As teams push towards the finish of the conference season and into postseason play, we have a more accurate barometer with a number of games and meaningful conference stats to review. You can use some of the stats below for the rest of the regular season and into post season play as you do your match-up analysis. The defensive dominator chart is also a good guide to reference for the start of next season when factoring in returning starters, coaching philosophy and a team’s defensive strength in a system.
The stats below are season-long numbers and it’s up to you to dig deeper into a team’s stat profile and recognize opponents faced, home/road splits, player injury impact, motivational factors and other scheduling and situations while also recognizing the importance of quality coaching, home court advantage and which teams are playing with a purpose and more interest. Plenty of teams will have ‘tossed the towel’ in some games down the stretch, knowing that their last hope for an NCAA tournament bid is winning the conference tournament in late February or early March.
Through February 5, 2018 here are the top defensive teams in college basketball with the following parameters:
• allow 41% or less field goal percentage
• allow 33% or less shooting from behind the 3-point arc
• allow 67 points or less per game.
 I’ve also noted how these defensive dominators do in rebounding the basketball and provided their Adjusted Defensive Efficiency Ranking from KenPom (351 teams).
From the Defensive Dominator chart below, also note that these teams are top-15 in the country in opponent average scoring margin:
Purdue, Cincinnati, Michigan State, Virginia, Texas Tech
Also, some teams not on the list are solid defensive teams and may also have positive coaching profiles. These teams just miss qualifying in various categories including rebounding margin, but may rank top-60 in adjusted defensive efficiency:
Wichita State, Ohio State, Tennessee, Maryland, Boise State
Use some of these stat profiles as a guide when handicapping the rest of the college basketball season along with the college conference tournaments (CCT’s), NCAA Tournament, NIT and other post season tournaments.
Note the stats below are from games against Division 1 opponents only.
Also note that only 3 teams from the defensive dominator list have a losing record against the spread (ATS) this season, perhaps offering some value on these teams down the closing stretch of the season – Syracuse, Texas A&M and Mississippi State. All three teams are out of the conference race for a championship, but each has at least 15 wins and are coached by long time mentors and veterans who believe in fundamentals and defense.
PPG – Points Per Game Defense
| Team – Conference | FG% Defense | 3-point % Def | Rebounding Margin | PPG Def | Adj Def Rank |
| Michigan State – Big Ten | 35.4 | 32.6 | 10.6 | 64 | 8 |
| Cincinnati – American (AAC) | 36.6 | 31.5 | 8.9 | 57 | 2 |
| Virginia – ACC | 37.4 | 29.2 | 1.5 | 52 | 1 |
| Syracuse – ACC | 38.4 | 32.9 | 5.8 | 63 | 10 |
| Central Florida (UCF) – AAC | 38.6 | 33 | 4.1 | 60 | 7 |
| Texas A&M – SEC | 39 | 31.4 | 7.5 | 67 | 5 |
| Grand Canyon – WAC | 39.1 | 26.8 | 4.2 | 62 | 23 |
| Georgia – SEC | 39.1 | 31.1 | 5.8 | 66 | 26 |
| Texas Tech – Big 12 | 39.5 | 31.5 | 5.3 | 63 | 3 |
| Houston – American | 39.5 | 32.5 | 6.1 | 66 | 41 |
| Purdue – Big Ten | 39.7 | 32.9 | 3.4 | 64 | 15 |
| Bradley – Missouri Valley | 39.9 | 32.4 | 3.8 | 63 | 49 |
| Missouri – SEC | 39.9 | 30.8 | 6.2 | 67 | 51 |
| E Tennessee State – Southern | 40.1 | 31.1 | 4.1 | 66 | 36 |
| Mississippi State – SEC | 40.1 | 32.3 | 3.9 | 65 | 14 |
| New Mexico State – WAC | 40.3 | 30.1 | 8.2 | 63 | 9 |
| San Diego – West Coast | 40.4 | 28.1 | 0.1 | 65 | 55 |
| Texas – Big 12 | 40.5 | 32.1 | 0.1 | 67 | 4 |
| Miami, FL – ACC | 40.7 | 31.3 | 2.6 | 66 | 11 |
| Rutgers – Big Ten | 41 | 32.8 | 2.7 | 65 | 20 |
| Jacksonville St – Ohio Valley | 41 | 32.6 | 5.8 | 66 | 104 |
Article posted at osga.com.
 Twitter
 Facebook